

Net Worth Tracker for Google Sheets & Excel
Track your assets, liabilities, and overall net worth over time. See your full financial picture in one place and watch your wealth grow month by month.
$9.99
Get this template on EtsyWhat's included
- Track all assets and liabilities in one place
- Monthly net worth snapshots
- Visual trend chart showing growth over time
- Categories for bank accounts, investments, property, and debt
- Automatic net worth calculation
- Works with Google Sheets and Microsoft Excel
How it works
The spreadsheet has three tabs: Dashboard, History Log, and a hidden Data tab for color settings. The Dashboard is split into two sides: assets on the left, liabilities on the right.
Setting up assets
Each row is one asset. Enter a name (e.g. Checking Account, Brokerage, Primary Home), the current value, a category (Cash & Savings, Investments, Retirement, Real Estate, Vehicles), and pick a color. The sheet auto-calculates what percentage each asset represents of your total and groups them by category.
Setting up liabilities
Same structure on the right side. Enter each liability (mortgage, car loan, student loan, credit card balance) with its current outstanding amount and category. Percentage of total and group totals calculate automatically.
Tracking over time
The History Log tab is where you record monthly snapshots. At the end of each month, log your total assets, total liabilities, and net worth. The Dashboard shows your current month-over-month change, and the History Log builds a long-term view of your trajectory.
Summary cards
At the top of the Dashboard, summary cards show total assets, total liabilities, net worth, and the change since last month, all updated automatically as you adjust values.
Available in dark and light themes
Both themes are functionally identical. Use the toggle above to switch between them.
Who this net worth tracker is for
Net worth is the one number that captures everything at once: what you own minus what you owe. It is also the slowest number in personal finance, which decides who this suits.
It is for people with more than one thing going on. A couple of accounts, some retirement money, maybe a house and a mortgage, a car loan. Enough moving parts that no single account statement tells you whether the year went well. If your finances are a current account and a credit card, this will not tell you anything a glance at both does not.
It is also for people who can look at a number quarterly without needing it to move. Net worth responds to years, not weeks. Anyone wanting the satisfaction of visible weekly progress will find this frustrating and should be tracking savings goals or debt payoff instead, where the numbers actually move at the speed of effort.
What you need before you start
Every account, both sides. Assets are current accounts, savings, brokerage, retirement, property, vehicles, and anything else you could sell. Liabilities are the mortgage, car loans, student loans, and current card balances.
Collecting them the first time takes an hour or so, and it is the hardest part. After that it is a quarterly update of numbers you already know where to find. Write down where each figure comes from as you go, because the annoying part of the second snapshot is remembering which of three retirement accounts you pulled which number from.
Two valuations need a rule rather than a lookup. Property is worth setting once from a recent estimate and revisiting yearly, not monthly, since a home value that jumps around on estimates makes your net worth chart mostly noise. Vehicles depreciate steadily, so either update them yearly or leave them out entirely. Leaving them out is defensible and produces a more stable number.
Using it in Google Sheets or Excel
Identical in both, so pick where you will open it. This one is checked rarely, so device syncing matters less here than for a daily tracker. Excel is a reasonable choice if the idea of a full account inventory in a Google account bothers you, and that is a legitimate reason to prefer local storage for this file specifically.
Copy before you enter anything, and back it up somewhere. This sheet accumulates history you cannot reconstruct: a lost budget costs you a month, a lost net worth log costs you every snapshot you ever took.
Filling in both sides
Assets on the left, liabilities on the right, each row a name, a value, a category, and a colour. The sheet works out what percentage each item represents and totals them by category.
Those percentages are the part worth reading. A net worth that is almost entirely one asset is a different financial position from the same number spread across several, even though the total is identical. Property-heavy net worth is real but not spendable, and someone with a large number and no accessible cash is one boiler failure away from a credit card balance. That is a reason to keep an emergency fund whatever the total says.
Be consistent rather than precise. If you value the house optimistically, do it the same way every quarter. The trend is the useful output, and a consistent method with a slightly wrong number produces a better trend than an accurate number you calculate differently each time.
Taking snapshots
The History Log is where the value actually accumulates. Each entry records total assets, total liabilities, and net worth at a point in time, and the Dashboard shows the change since last month.
Monthly is the documented cadence and quarterly is the one most people sustain. Either works. What does not work is skipping a year and then trying to reconstruct where you stood, because the past values are gone and the chart has a hole in it. Put a recurring reminder in your calendar the day you buy this, and log the number even in the months it went down.
It will go down sometimes. Markets fall, cars depreciate, and a month with a large planned purchase shows up as a decline. A log with only the good months in it is worse than no log, because it will tell you a trend that is not true.
What moves the number
Two things, and only two: the gap between what you earn and what you spend, and the return on what you have already saved. In the early years the first dominates so heavily that the second barely registers, which is a useful thing to know before you spend a weekend optimising investments while the monthly surplus goes unexamined.
Which means the tools that actually move this number are the everyday ones. A budget spreadsheet is what creates the gap in the first place. The debt payoff tracker works the liabilities side, and clearing a balance improves net worth exactly as much as saving the same amount. The savings goals tracker works the assets side with targets you can actually feel.
This tracker is the scoreboard. It confirms whether the rest of it is working, over a timescale long enough to be honest, and that is worth having precisely because none of the other sheets can tell you.
Related articles
Frequently asked questions
What counts as an asset?
Anything you own with monetary value: checking and savings accounts, investments, retirement accounts, property, vehicles. The tracker has categories for each type.
How often should I update it?
Monthly is ideal. Update your balances at the end of each month and the tracker builds a historical view of your net worth trajectory.
Can I track joint net worth with a partner?
Yes. You can include both partners' accounts in the same tracker to see your combined financial picture.
More spreadsheets
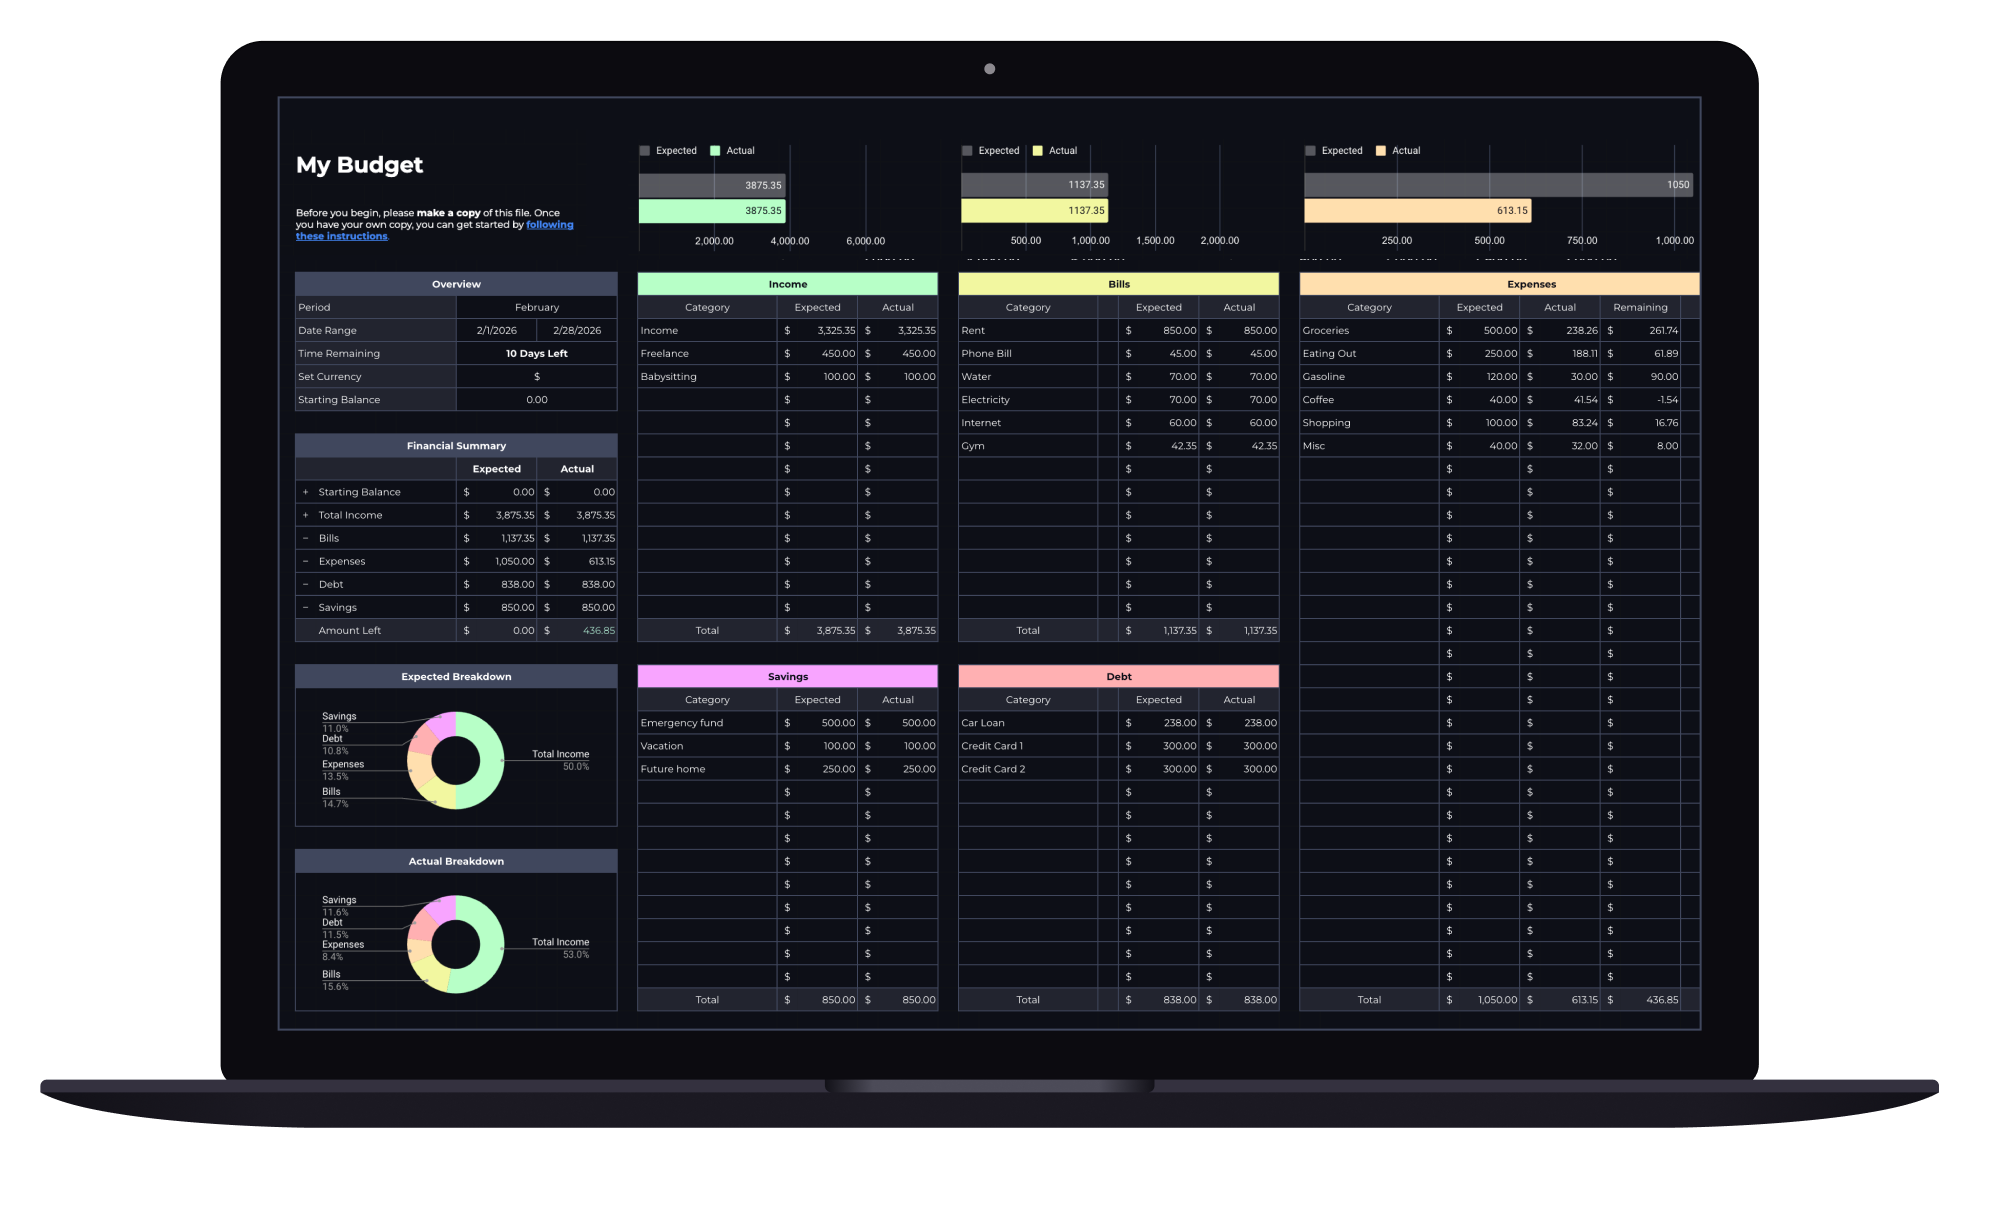
Budget Spreadsheet
Track your income and daily expenses with real-time progress indicators that show exactly where you stand each month. Works with Google Sheets and Microsoft Excel.
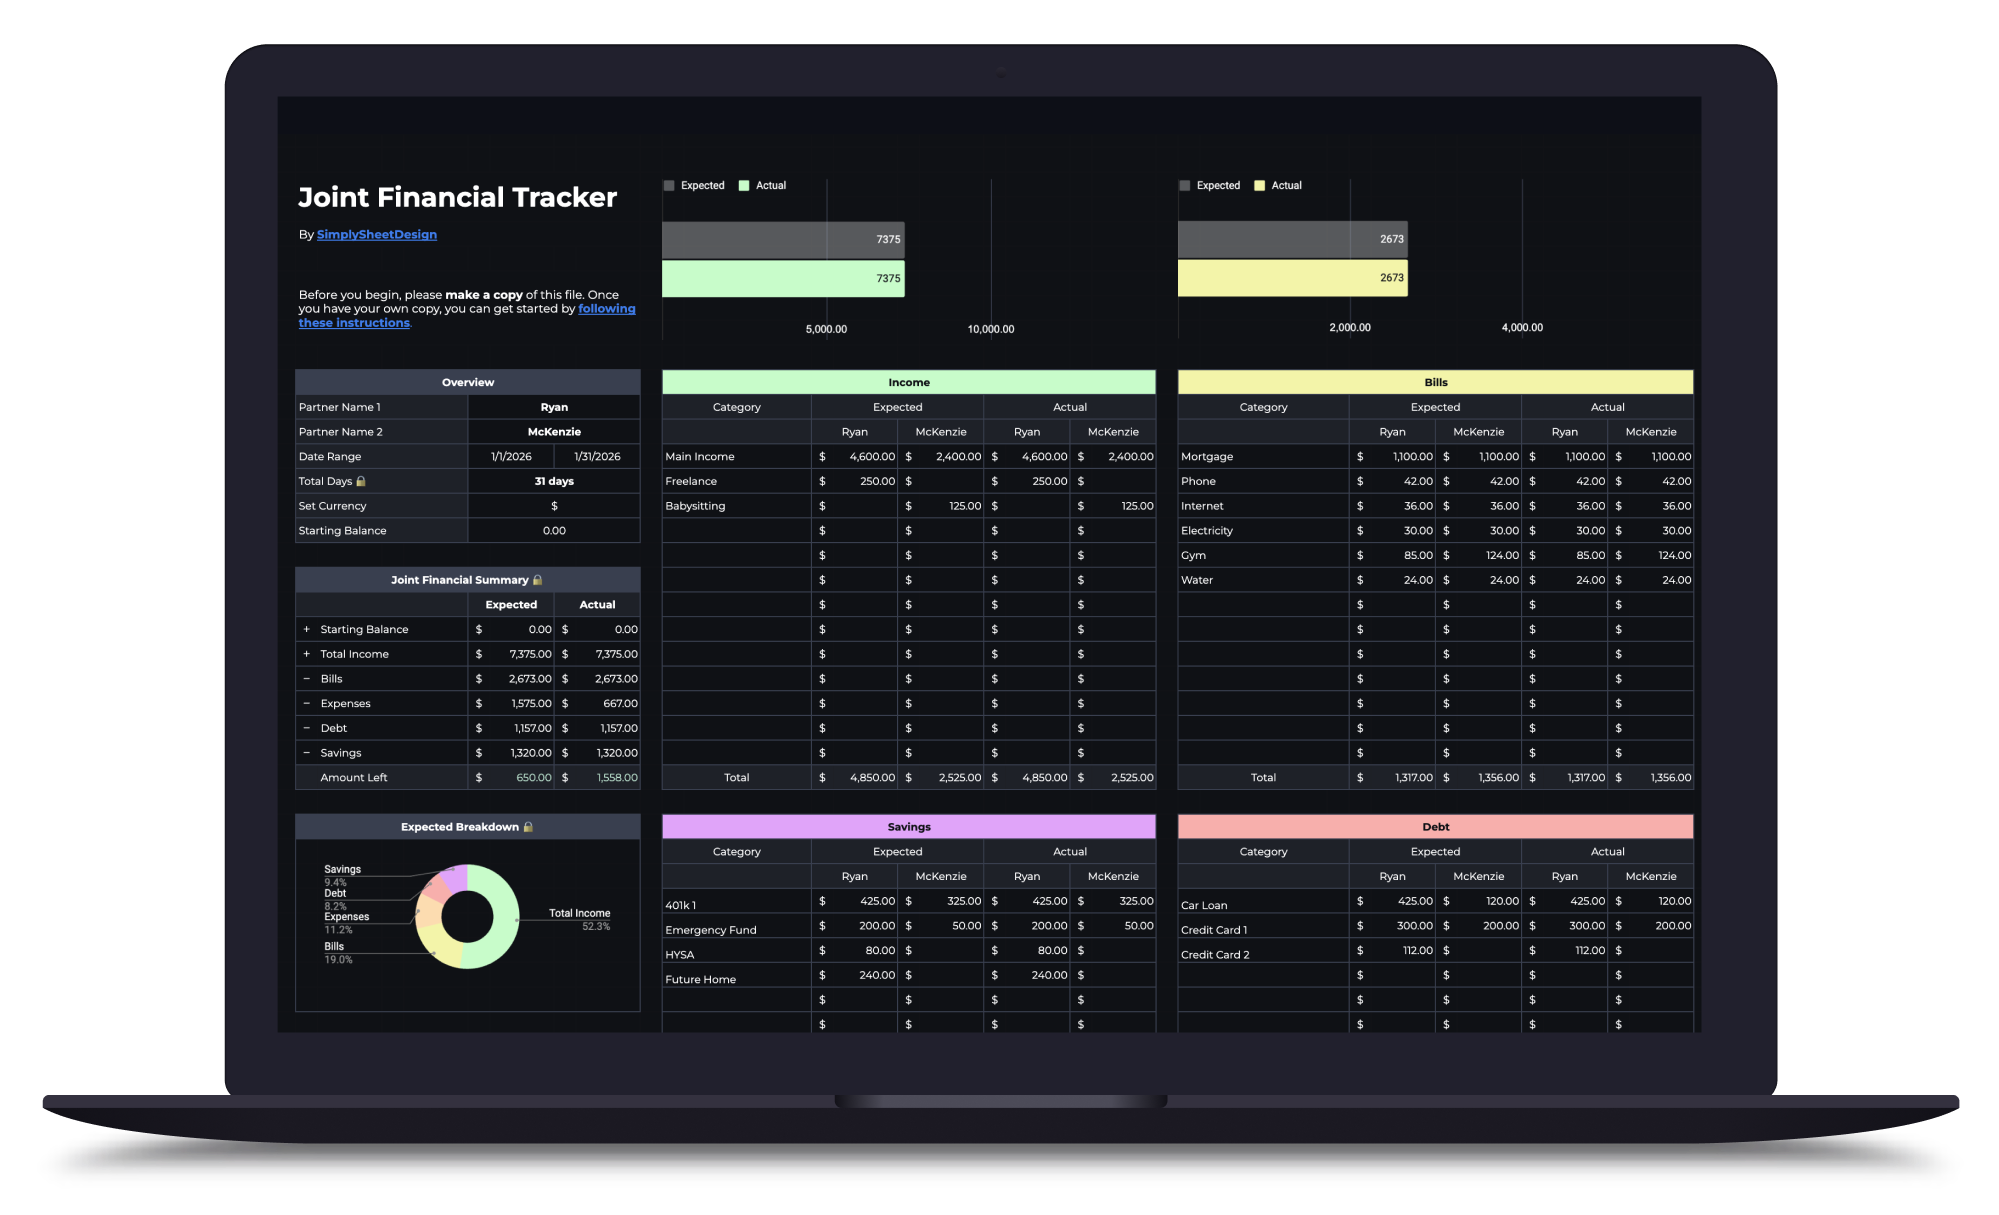
Couples Budget Spreadsheet
Split bills, track shared and personal expenses, and manage savings together. Built for two incomes, one shared financial picture.

Debt Payoff Tracker
See your total debt, log payments, and watch your balances drop month by month with clear visual progress. Track credit cards, loans, and any other debt.